Sales Performance Dashboard
The Client 🤵
A prominent FMCG distributor in the Middle East, overseeing a network of over 200 branches and managing a portfolio of more than 3,000 SKUs, serving 4,000+ customers .
The Problem ⛔
-
The Client encountered challenges in managing end-to-end supply chain, tracking both primary and secondary sales. Data came in from different silos, such as various sales platforms, payment gateways, and refund systems. The Client had no visibility on the Inventory across Primary & Secondary Sales Channels.
-
The Client struggled to manage and process large volumes of Sales and Refund data. The team relied on outdated excel techniques due to which creating reports manually proved to be a laborious, time-consuming and error-prone.
-
They lacked key metrics and a unified view of 360 Degree Sales Analysis.
Our Solution ✔️
-
We automated the data cleaning process, consolidating multiple scattered data sources into a single unified system.
-
We modeled the most relevant KPIs concerning primary and secondary sales that would guide the team on high-priority metrics for better decision-making.
-
We then aggregated all this data into a visually compelling dashboard. The dashboard carried six key screens with drill-down capabilities that provided deeper insights beyond surface-level metrics.
We’ve kept the dashboard clean and minimal, take a look:
Screen 1 - Home

Screen 2 - Executive Summary

Key KPIs :
-
Yearly and monthly sales trends
-
Executive summary
-
Top and bottom 5 salespersons of the year
Screen 3 - Monthly Summary

Key KPIs :
-
Total number of customers, Average billings, Net sales and sales returns
-
Cumulative monthly sales growth trend
-
Contribution from top 10 customers and brands
Screen 4 - Category-wise Sales Trends
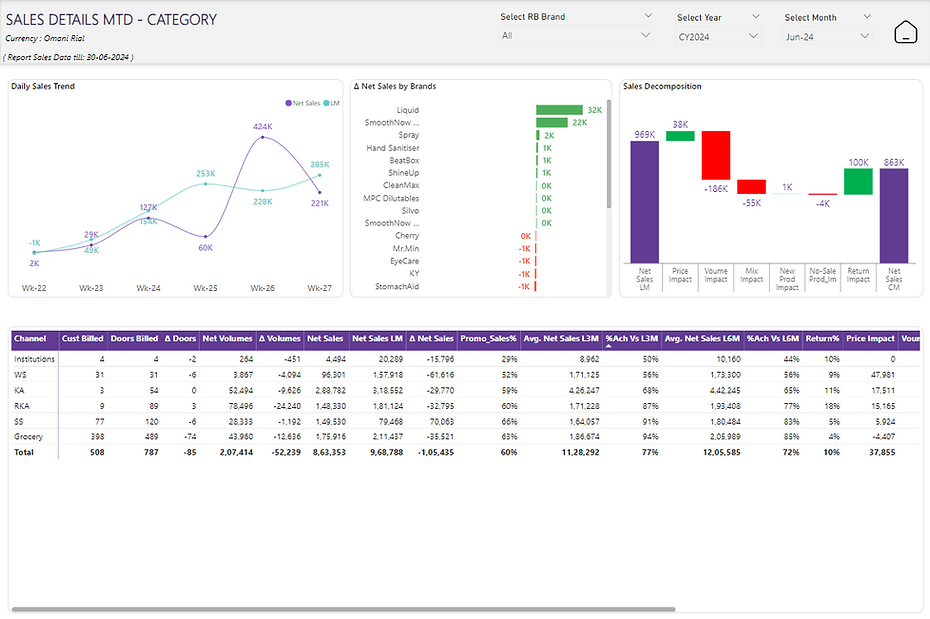
Key KPIs :
-
Daily sales trends
-
Total sales by all brands
-
Sales decomposition
Screen 5 - Customer-wise Sales Trends

Key KPIs : Similar to the previous KPIs, but with respect to customer trends
Screen 6 - Sales Person-wise Sales Trends

Key KPIs : Similar to the previous KPIs, but with respect to sales-person trends
Our Impact 🚀
-
The client was able to effectively monitor the entire sales value chain, this improvement alone resulted in savings of 2 million dollars per month.
-
We drastically cut down manual reporting, freeing up 100 man hours each month. Reports that earlier took more than a week were available on demand, making the entire reporting accurate and efficient.
Timeline ⏳
Project Discussion
Project
Scope
Automation
&Testing
KPI
Calculation
Visualization
Handover &
Manual Training
Day 2
Day 1
Day 8
Day 14
Day 18
Day 21