One of our prominent clients was generating thousands of sales transactions. We helped them transform their raw sales data into actionable insights, giving management a clear view of performance across customers, products, regions, channels, and sales teams.
The client had thousands of sales transactions every month, but no clear answer to seemingly simple questions:
Which products are actually driving growth?
Which customers contribute the most value?
Which sales representatives consistently outperform others?
Which regions deserve more investment?
Are sales trends improving or declining?
Like many growing businesses, they had plenty of data but very little visibility.
The Client struggled to manage and process large volumes of Sales and Refund data. The team relied on outdated Excel techniques, due to which creating reports manually proved to be laborious, time-consuming and error-prone.
They lacked key metrics and a unified view of 360 Degree Sales Analysis..
Our Solution ✅
An interactive Sales Performance Dashboard that consolidates sales transactions, customer data, product performance, and Sales metrics into a single analytical platform.
The dashboard enables stakeholders to monitor sales performance from a high-level executive view while allowing detailed analysis of individual products, customers, sales representatives, regions, and time periods.
We’ve kept the dashboard clean and minimal, take a look:
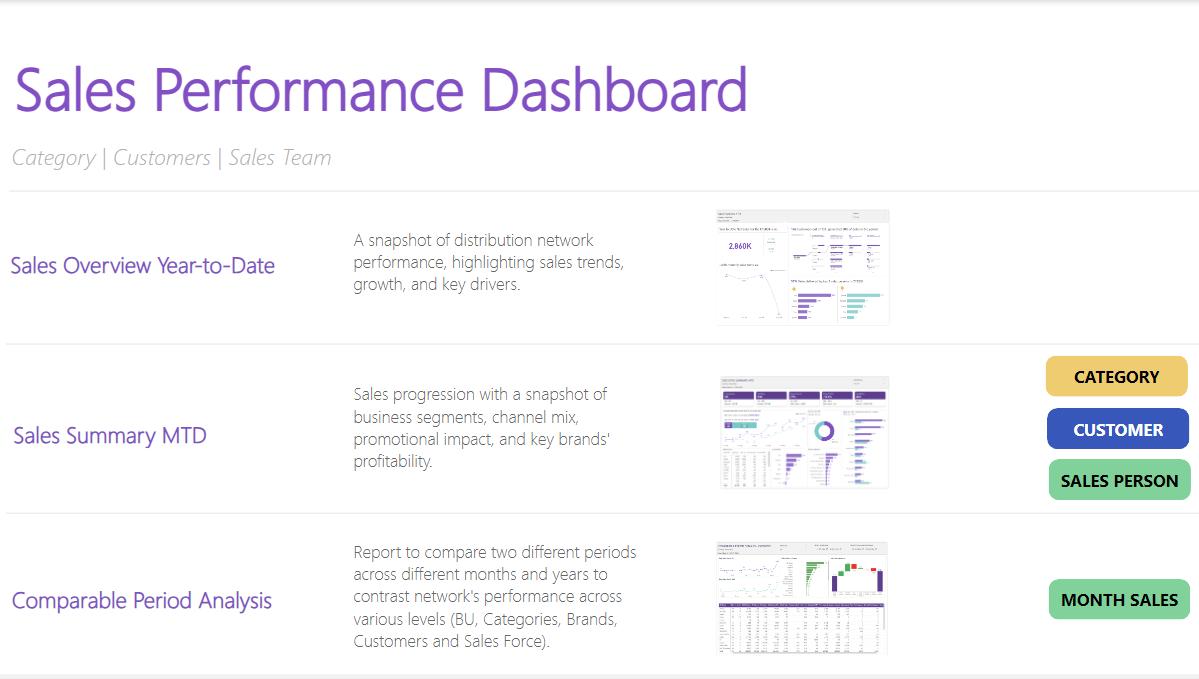
Screen 1 - Home
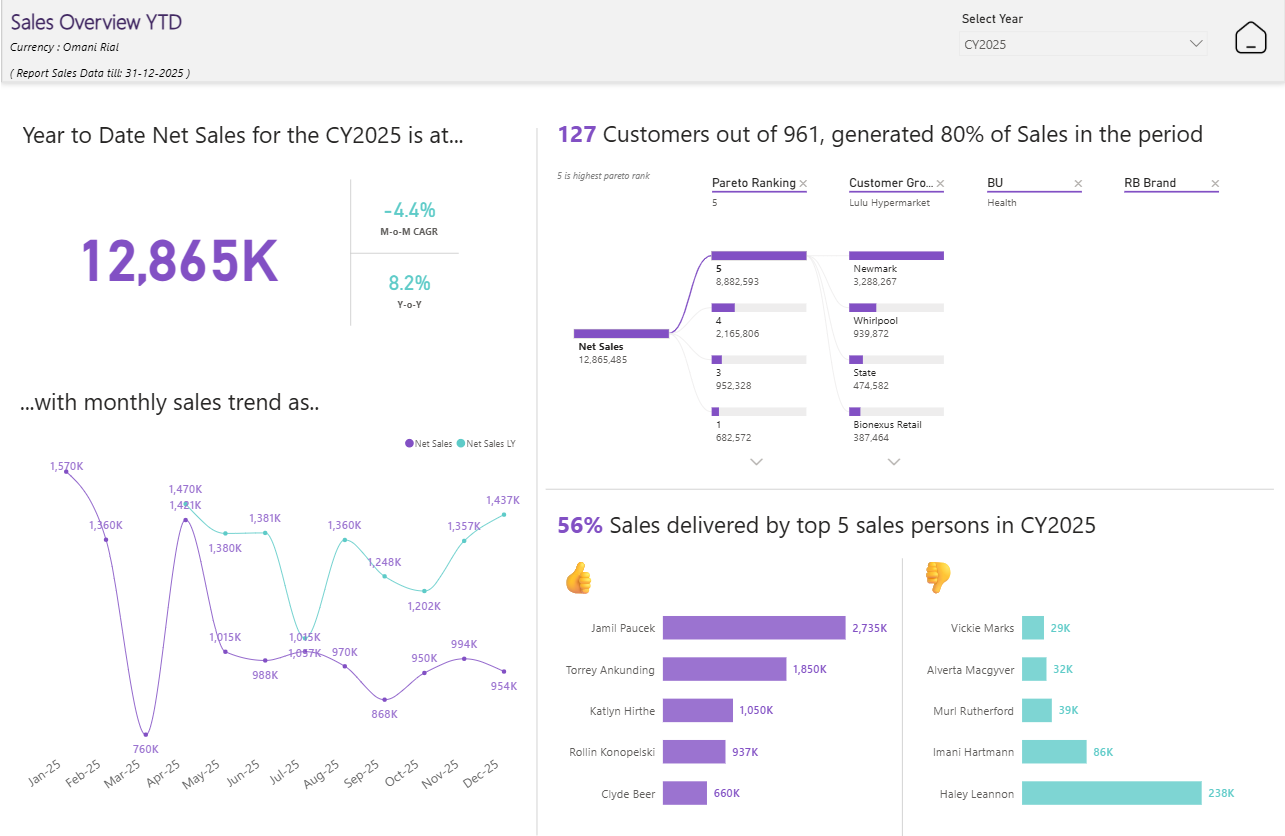
Screen 1 - Sales Overview
Key KPIs :
Year-to-date net sales with MoM CAGR and YoY growth
Monthly net sales trend compared with last year
Pareto analysis showing customers contributing 80% of sales
Top 5 and bottom 5 salespersons for the selected year
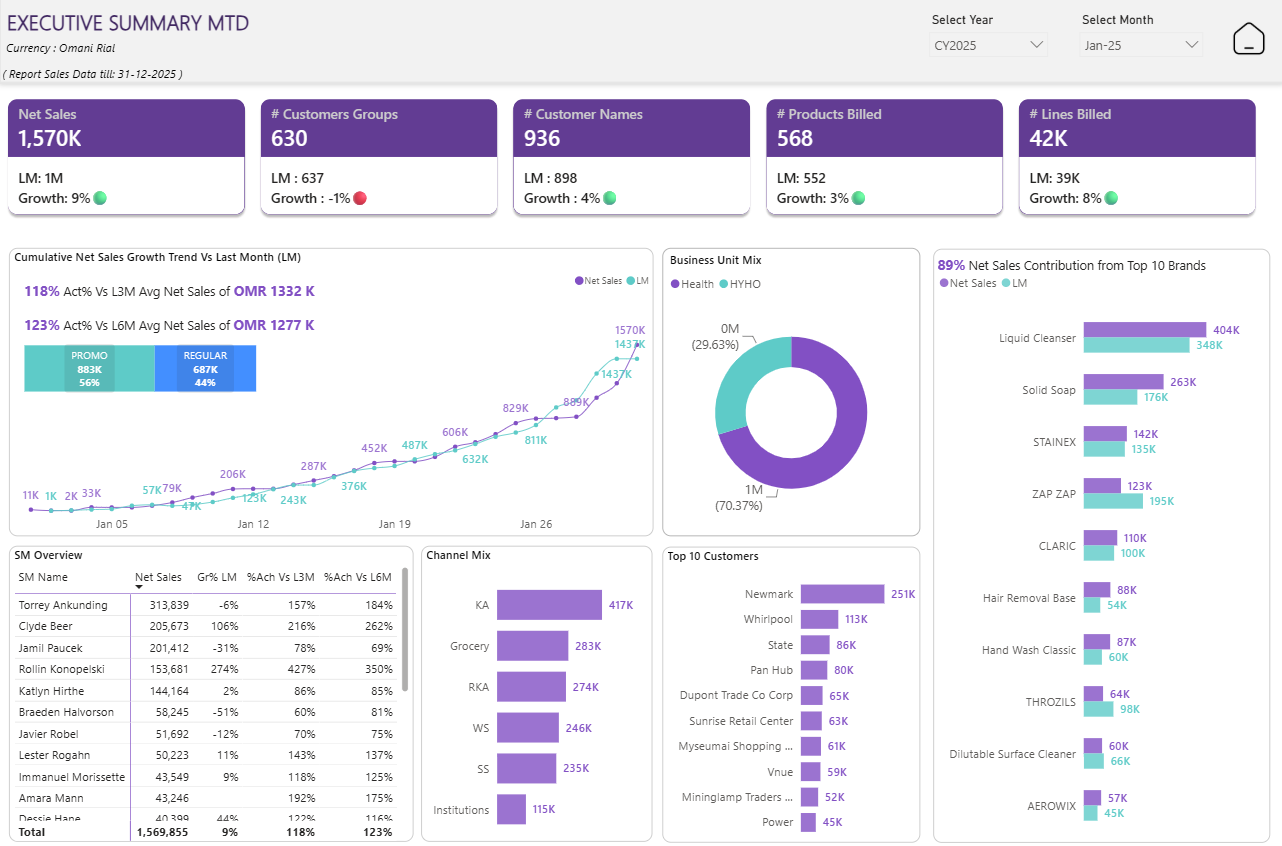
Screen 2 - Executive Summary
Key KPIs
MTD summary of net sales, customer groups, customer names, products billed, and lines billed
Comparison with last month, including growth % for each key metric
Cumulative net sales trend vs last month with L3M and L6M average sales comparison
Sales split by business unit, channel, salesperson, top customers, and top brands
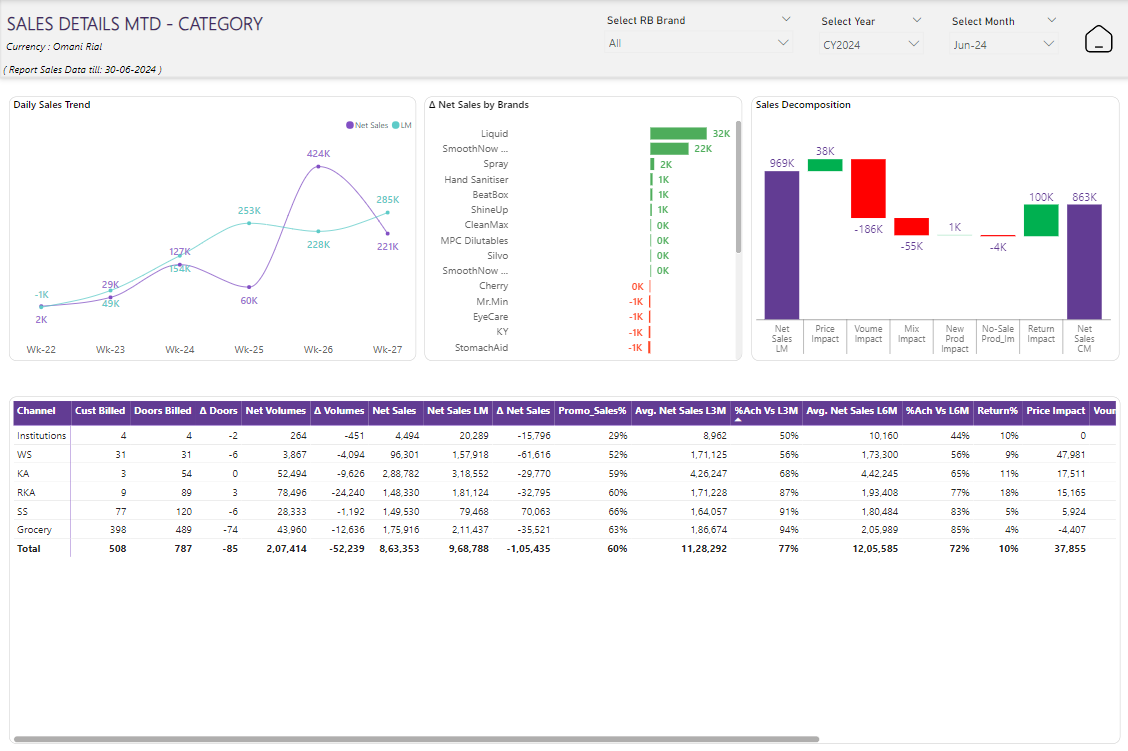
Screen 4 - Category-wise Sales Trends
Key KPIs
Daily sales trends
Total sales by all brands
Sales decomposition
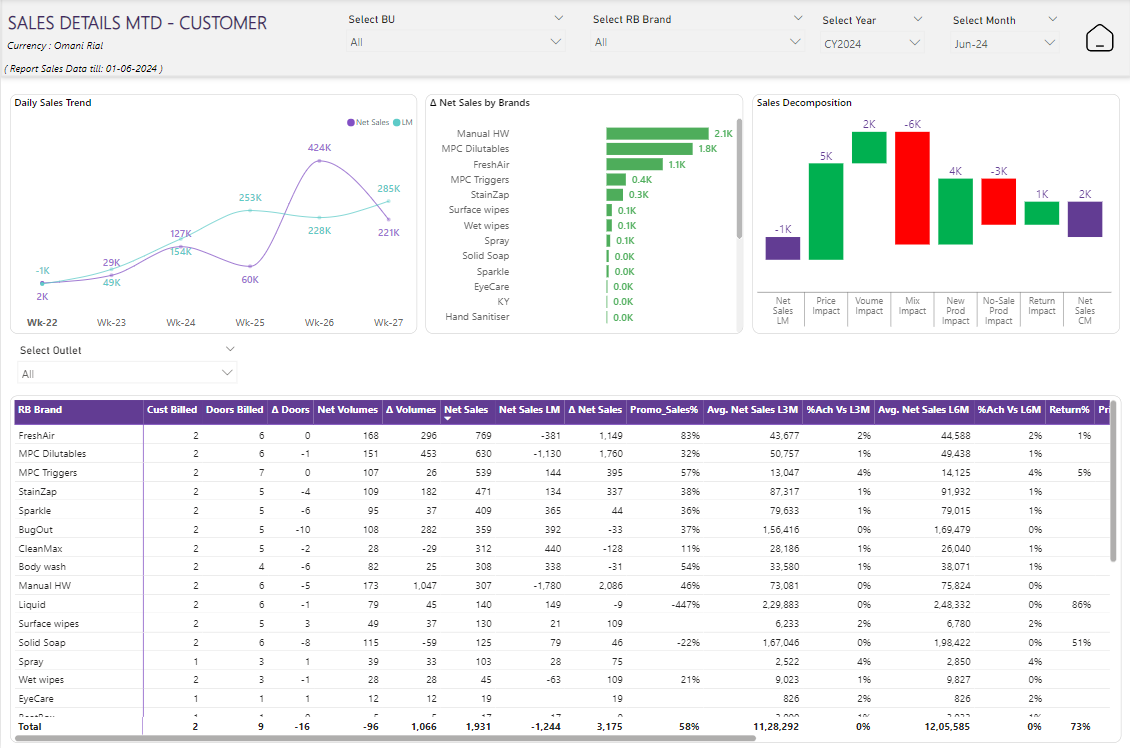
Screen 5 - Customer-wise Sales Trends
Key KPIs: Similar to the previous KPIs, but with respect to customer trends
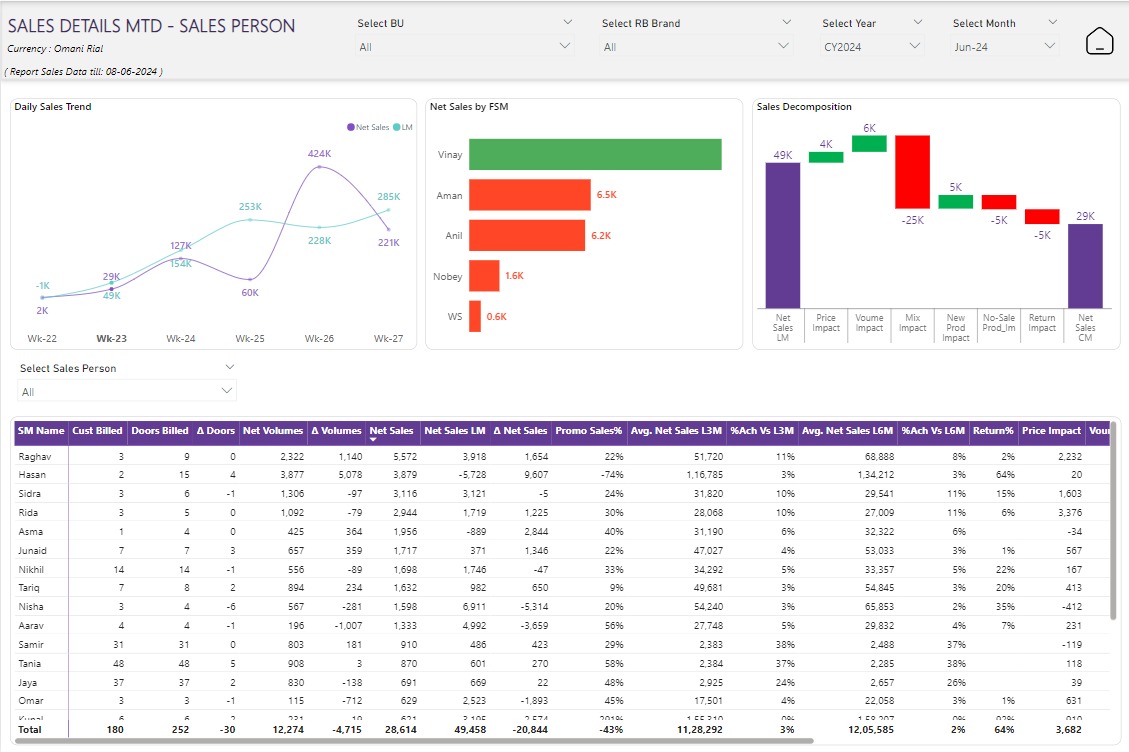
Screen 6 - Sales Person-wise Sales Trends
Key KPIs: Similar to the previous KPIs, but with respect to sales-person trends
Our Impact 🚀
The client was able to effectively monitor the entire sales value chain, this improvement alone resulted in savings of 2 million dollars per month.
We drastically cut down manual reporting, freeing up 100 man hours each month. Reports that earlier took more than a week were available on demand, making the entire reporting accurate and efficient.