Transforming Recruitment Reporting for a Leading Home Appliances Company
A prominent Indian multinational home appliances company, operating from four key locations with a global footprint spanning 18 countries and a workforce exceeding 4000 people.
Consolidating and Cleaning data from Multiple sources: Data came in from several sources including job requisition software, multiple Google Sheets and Excel files, the real challenge was data inconsistency and consolidation of this fragmented data. Despite dedicating a full-time team to data consolidation and cleaning, even the most basic reports consumed 50+ hours each week.
Error Prone Manual Analysis: The manual wrangling and cleaning of data led to errors in calculations which made the end result unreliable.
No birds-eye view of overall recruiters’ performance: Ad-hoc analysis without a unified view made it difficult to see the big picture of the overall recruiter performance.
Our Solution ✅
A Comprehensive Power BI Dashboard that addresses pain points by:
Creating a centralized system for automating and gathering data from fragmented sources: A comprehensive template was developed to ensure consistency in data collection from recruiters. We built a system to gather, clean and automate existing and new data ready to be used for analysis.
Identifying and Calculating the most important KPIs / metrics: We divided the recruitment analysis into 3 phases: Job Requisition, Candidate Interview, and Recruitment Cost phase.
Building an Impactful Dashboard: We gave a “priority vs detail” analysis to every single metric, ensuring the most important numbers stood out at the top for business leaders, while deeper drill-downs enabled detailed insights. This provided a holistic view of recruiter performance and helped identify performance gaps.
We’ve kept the dashboard clean and minimal, take a look:
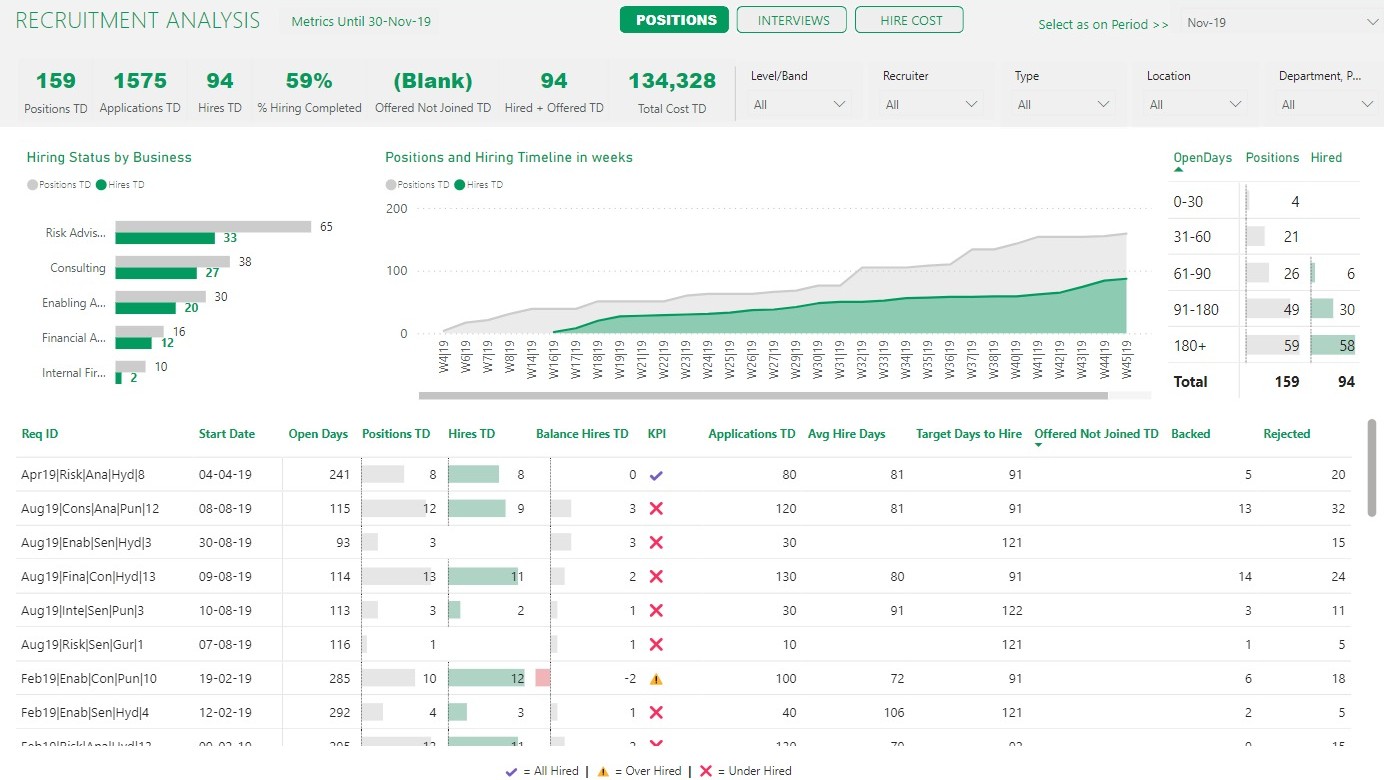
Screen 1 - Recruitment Position Analysis
Key KPIs
Position Related – Total Positions, Hires Completed, Balance Hires, % Completion, Applications
Delays and Benchmarks – Offered but not joined, Hire Days v/s Target Hire Days, Backed and Rejected
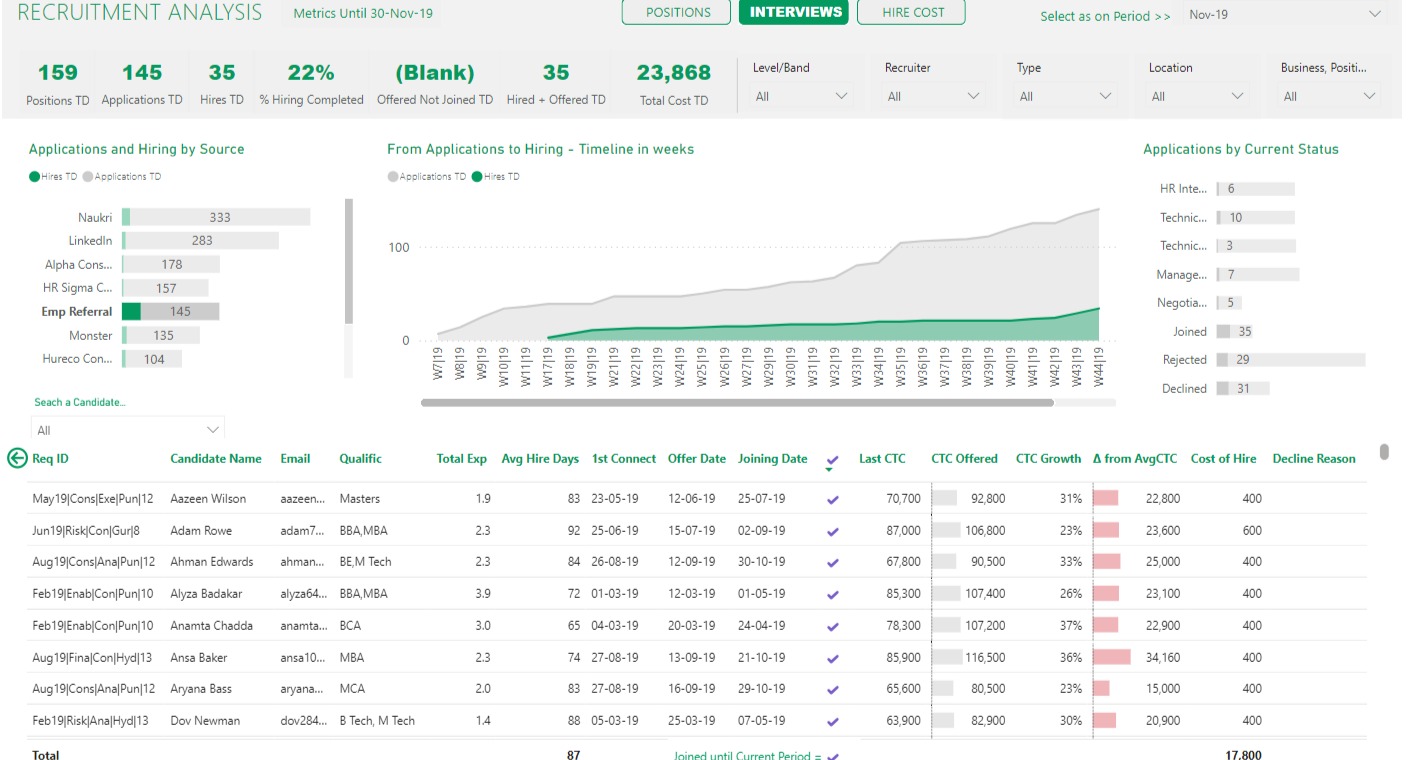
Screen 2 - Interview / Application Analysis
Candidate Interview KPIs :
Compensation – Last CTC and CTC Offered, % Growth, Delta from the Avg, Cost of hire
Interview Staging
Timelines – Avg Hire Days
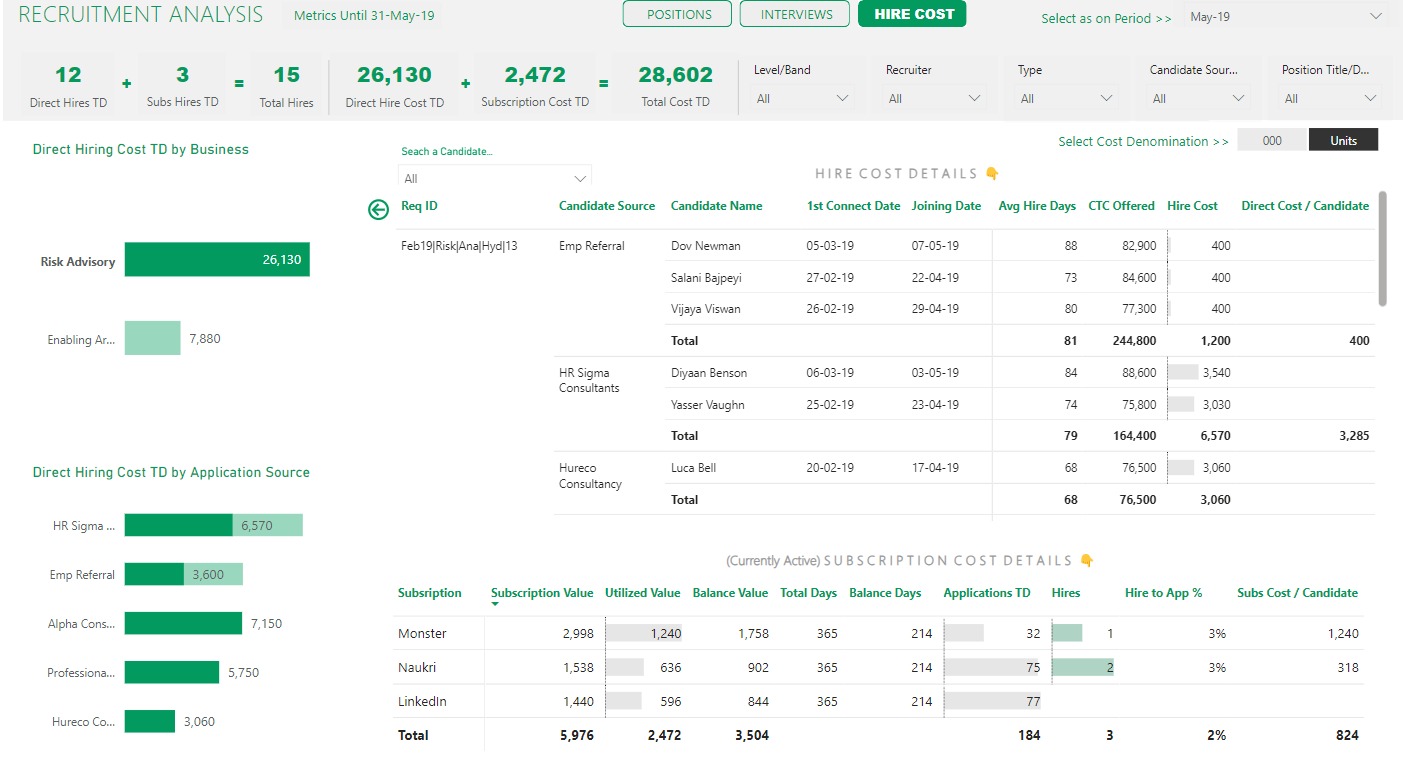
Screen 3 - Hire Cost Analysis
Cost KPIs
Candidate Hire Cost
Indirect Portal / Service Cost
Hire Cost / Candidate
Hire to Application Ratio
Our Impact 🚀
Time Saved: The company was able to cut down 50 manual work hours in a week and was now able to focus on taking strategic decisions on data.
Keeping the numbers straight: They were able to zero manual data entry errors through automation and standardized formats by simply employing our template.
Focused on what matters most: Business leaders were now monitoring critical KPIs to manage recruitment more efficiently.
On-demand targeted tracking and analysis: Our dashboard proved to be the key to unlocking recruiters’ full potential.
Holistic management view: Visualizations acted as the catalyst for rapid and confident decision-making.