The Learning & Development department was responsible for an extensive range of training programs – Over the past year, they managed over 20,000 training sessions, impacting more than 35,500 employees through diverse platforms such as classroom training, Udemy courses, mandatory compliance modules, and the company’s internal LMS.
Despite this impressive scale, the department faced critical reporting challenges due to multiple fragmented data sources. They struggled to manually consolidate and analyze data from 20+ scattered systems.
They heavily relied on outdated Excel techniques, like pivot tables, creating dimensions using manual Vlookups and manual consolidation of the data making the process not only time-consuming but increasingly unsustainable.
The L&D Leadership team not only lacked a consolidated view but also missed out highly relevant key metrics to track their performance.
Our Solution ✅
We analyzed the problem and automated this entire process by creating a comprehensive Power BI Dashboard. We started off by:
Redefining relevant KPIs: We reviewed the scope of our work and took a look at the reports to identify and define the most significant KPIs that would help the team track their L&D Initiatives. While standard KPIs such as total man-hours trained remained essential, we also picked out more nuanced and insightful metrics like Training cost leak – by absenteeism, training recency, training initiation delay and employee satisfaction post-training.
Creating a Centralized Data Model: We automated data cleaning and consolidation from multiple sources including learning management systems (LMS), HR databases, and LinkedIn & Udemy learning.
Building a Substantive Dashboard: We aggregated all this data into a single dashboard, breaking it down into insightful visual summaries. The dashboard carried six key screens, placing the most important numbers on top with more details accessible upon further drilling down.
We kept it clean and simple. Take a look:
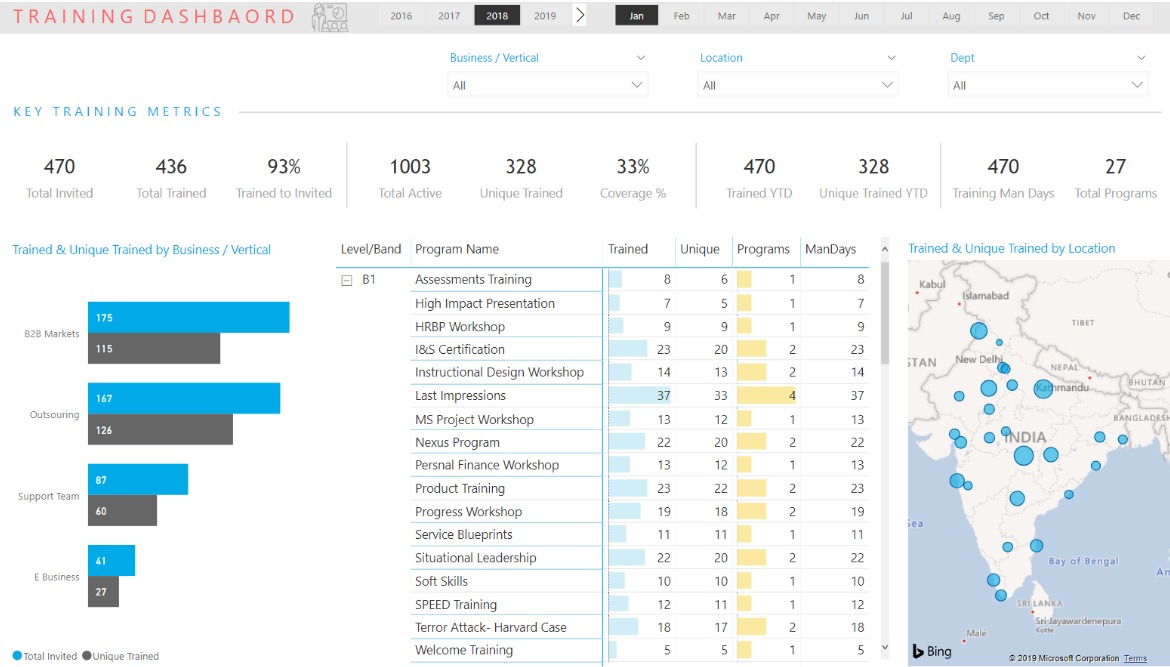
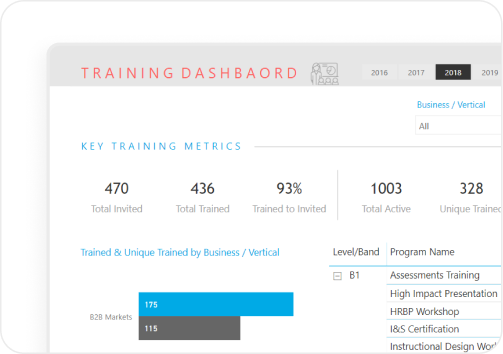
Screen 1 - L&D Overview Analysis
Key KPIs
Overview: Total Invited, Total Trained, Unique Trained, Total Active Employees, Training Man-Days, Total Programs
YTD Numbers
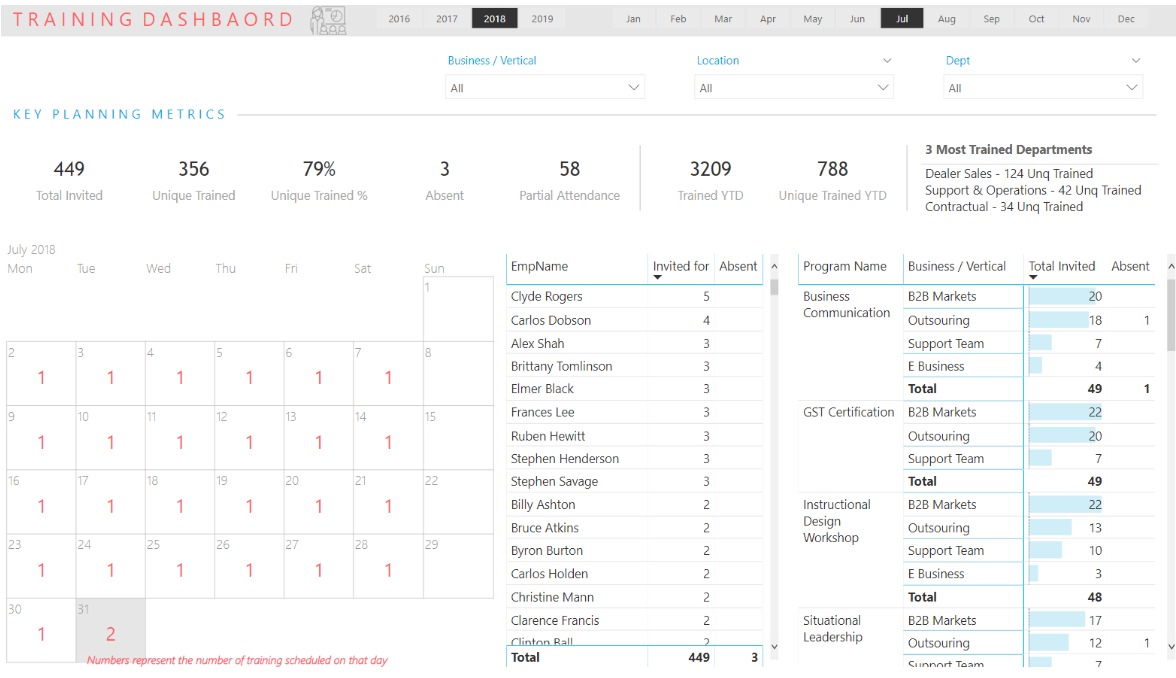
Screen 2 - L&D Planning Analysis
Key KPIs :
Some Metrics carried from Overview Analysis
Absent Employees, Partial Attendance Employees, Invites Sent, Most Trained Departments.
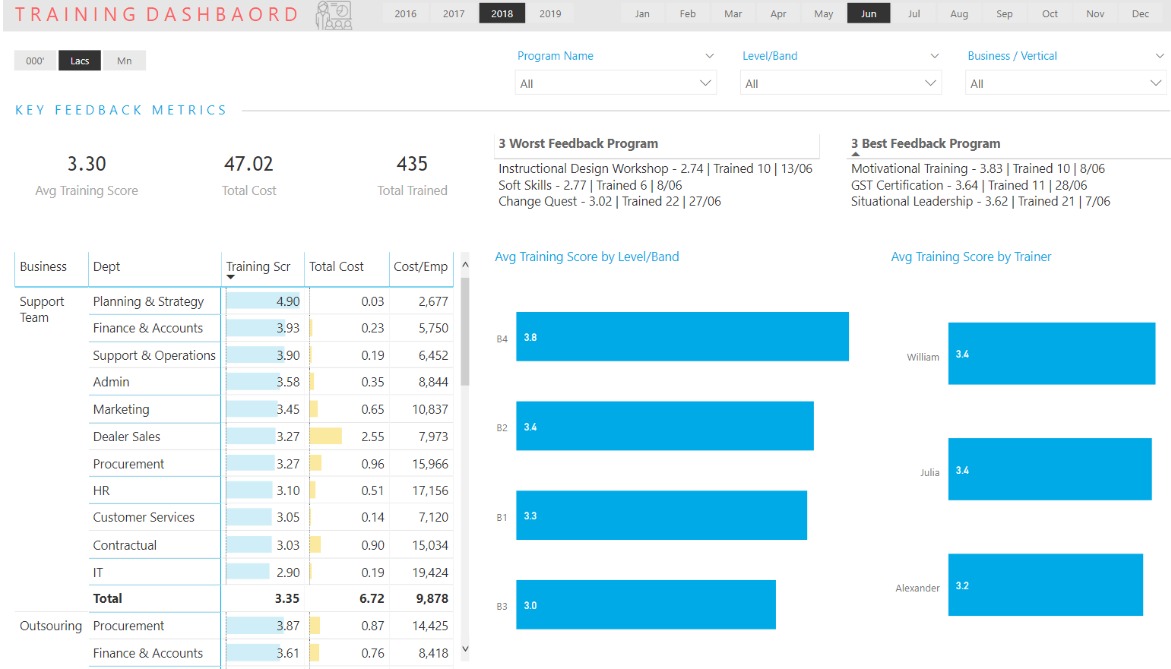
Screen 3 – L&D Feedback Analysis
Key KPIs
Avg Training Score, Total Cost, Total Trained
3 Best Feedback Programs, 3 Worst Feedback Programs
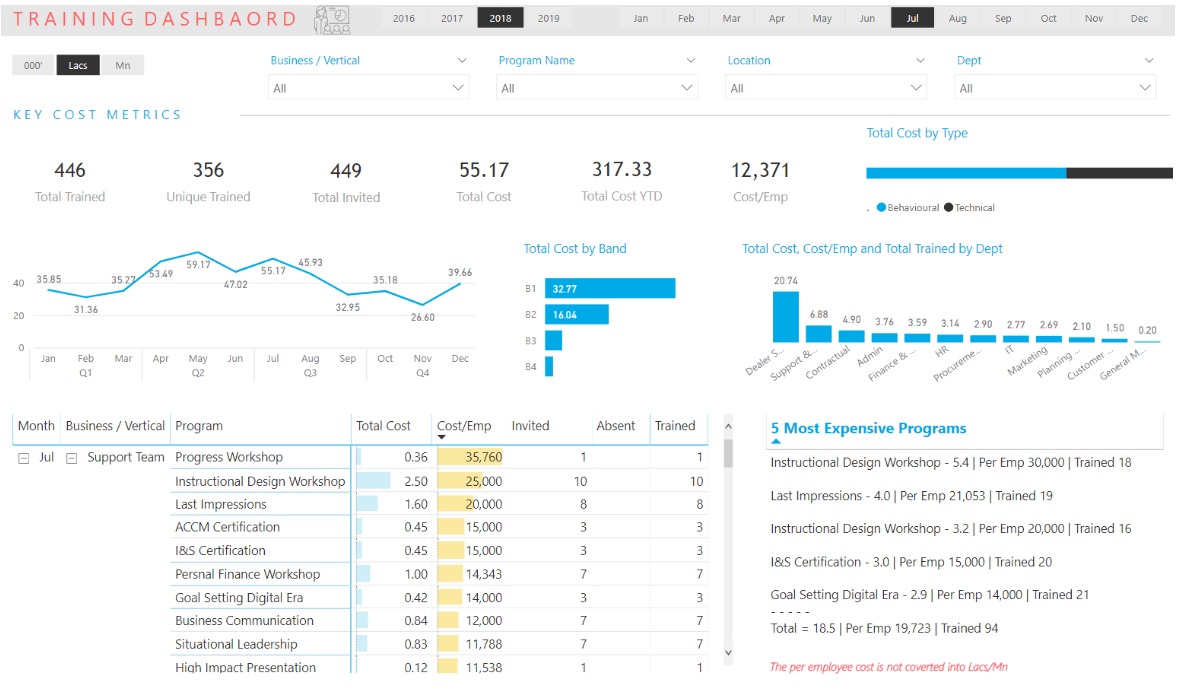
Screen 4 - L&D Cost Analysis
Key KPIs
Total & Unique Trained, Total Invited
Training Cost, Cost YTD, Cost per Employee
5 Most Expensive Programs.
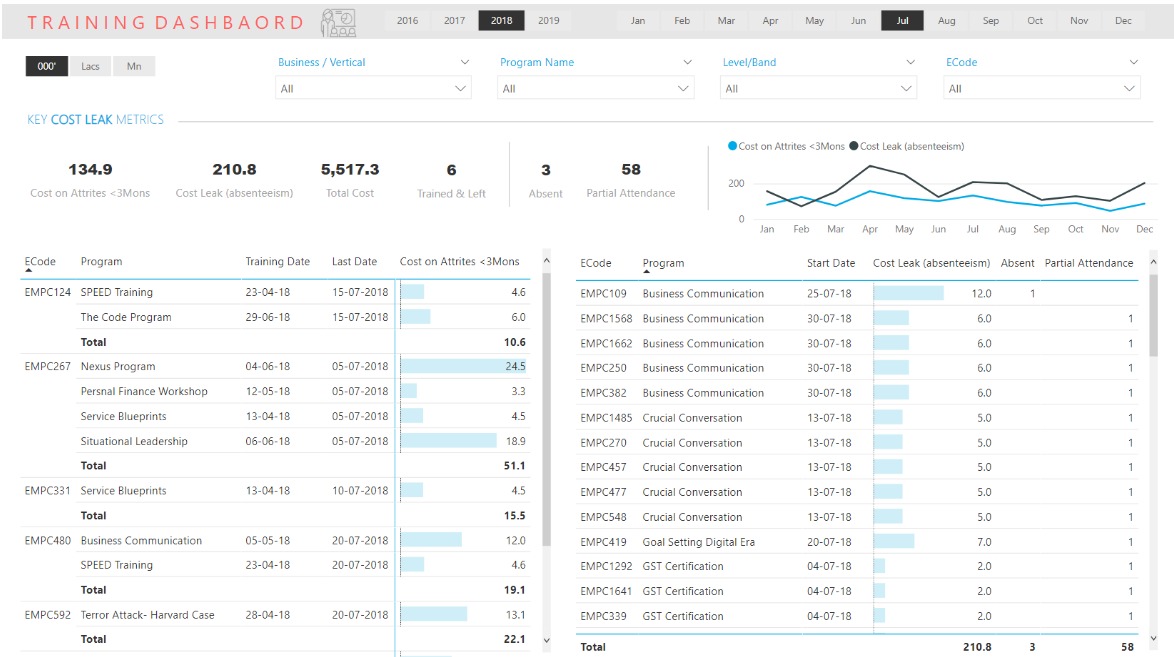
Screen 5 – L&D Cost Leak Analysis
Key KPIs
Training Cost Leak due to Attrition, Employees Trained and Left
Training Cost Leak due to Absenteeism, Absent and Partially Absent
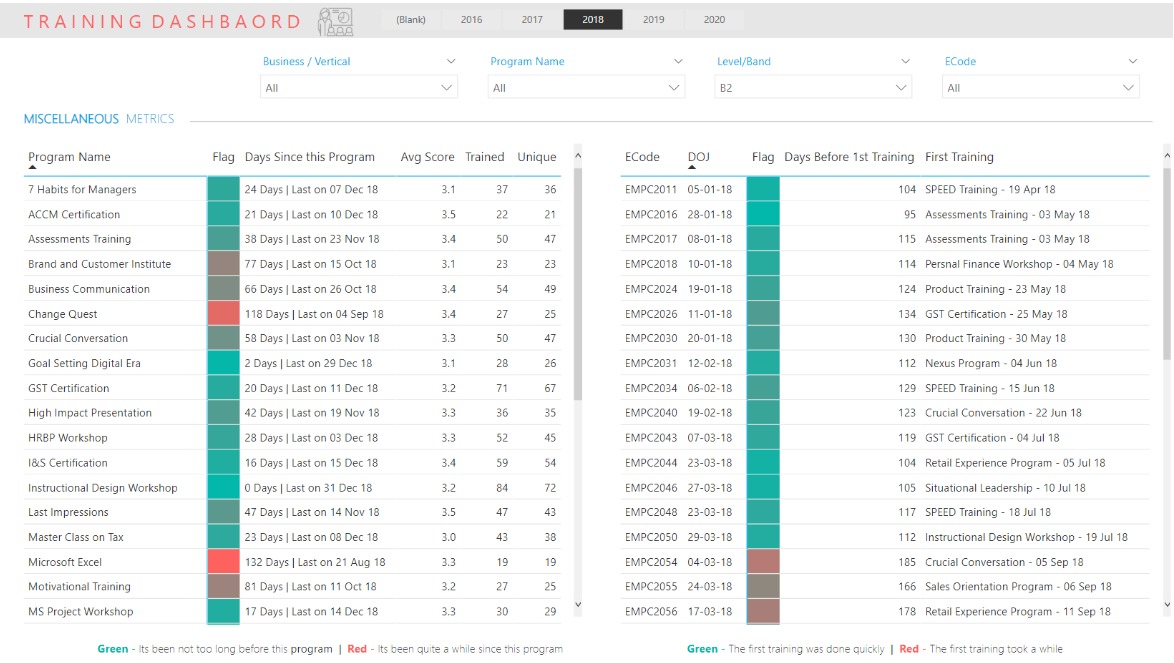
Screen 6 - L&D Miscellaneous Analysis
Cost KPIs
Days Passed Since the Program was Last Done, Highlighting Flag, Avg Training Rating
Total Trained and Unique Trained
No of Days Before the Employee Receives his First Training, First Training Name and Date
Our Impact 🚀
Six Views to Rule Them All – The dashboard delivered a unified and centralized view of every learning program, no matter the source, making data easily accessible in one place. It didn’t just summarize the information; it showcased the most crucial metrics and KPIs in a clean, professional layout, helping turn data into decisions with just a glance.
From Weeks to Minutes – With automated reporting, manual intervention was reduced to near zero, saving us 40-50 man-hours per month. This significant time saving transformed a previously recurring task that used to take about a week into an instant process.
Insights at Your Fingertips – With automated data refreshes, the client could access the most current information whenever needed. Reports were readily available for managerial consumption on demand, providing critical insights for quick decision-making as soon as the need arose.
Plugging the Money Leaks – By introducing creative KPIs like cost leaks, the dashboard helped the team pinpoint areas where they were losing money and identify thresholds for high-value programs, enabling more efficient allocation of resources. For instance, absenteeism fell from 20% to 10% owing to proactive monitoring. This worked out to 150,000 USD worth of savings per annum.
Accelerated Decision Making – The dashboard facilitated faster decision-making by providing adept data and insights, allowing the client to quickly respond to challenges and opportunities with confidence.