Invoice and Receivables Management for a Trading Company
A mid-sized trading company, processing over 1,500 invoices and payment transactions every month, was struggling to reconcile invoices and receipts across disconnected data sources.
The client had two disintegrated data sources – the invoice data and the payment receipts. When customers made lumpsum payments, the client had to manually set-off payments received against invoices using the FIFO method.
This process was tedious, time-consuming and error-prone. There was no as-on-date report that indicated how many invoices were due and how many were settled.
Our Solution ✅
We set up a clear reporting system that streamlined invoices and payments reconciliation by integrating data sources, automated payment allocation against due invoices, and providing as-on-date company and customer wise reports.
Our dashboard had 2 screens -
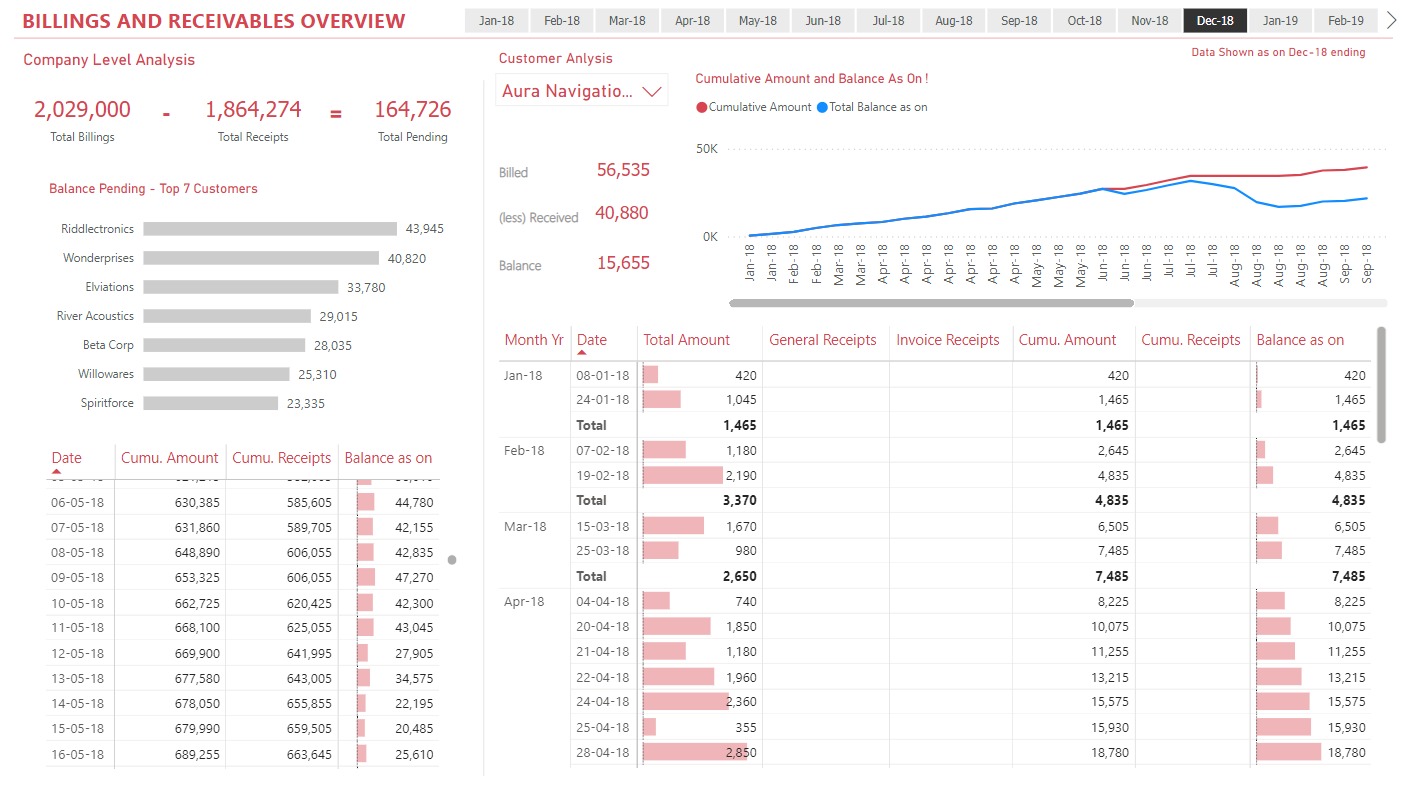
Billing and Receivables Overview - It provided an overview of billings, payments received and balance due at company and customer level.
Key KPIs
Total Billings, Total Receipts and Amount Pending till date, Delays and Benchmarks
Balance pending from the top 7 Customers
Further drill down to provide detailed monthly reports on cumulative billings and outstanding balances of the selected customer.
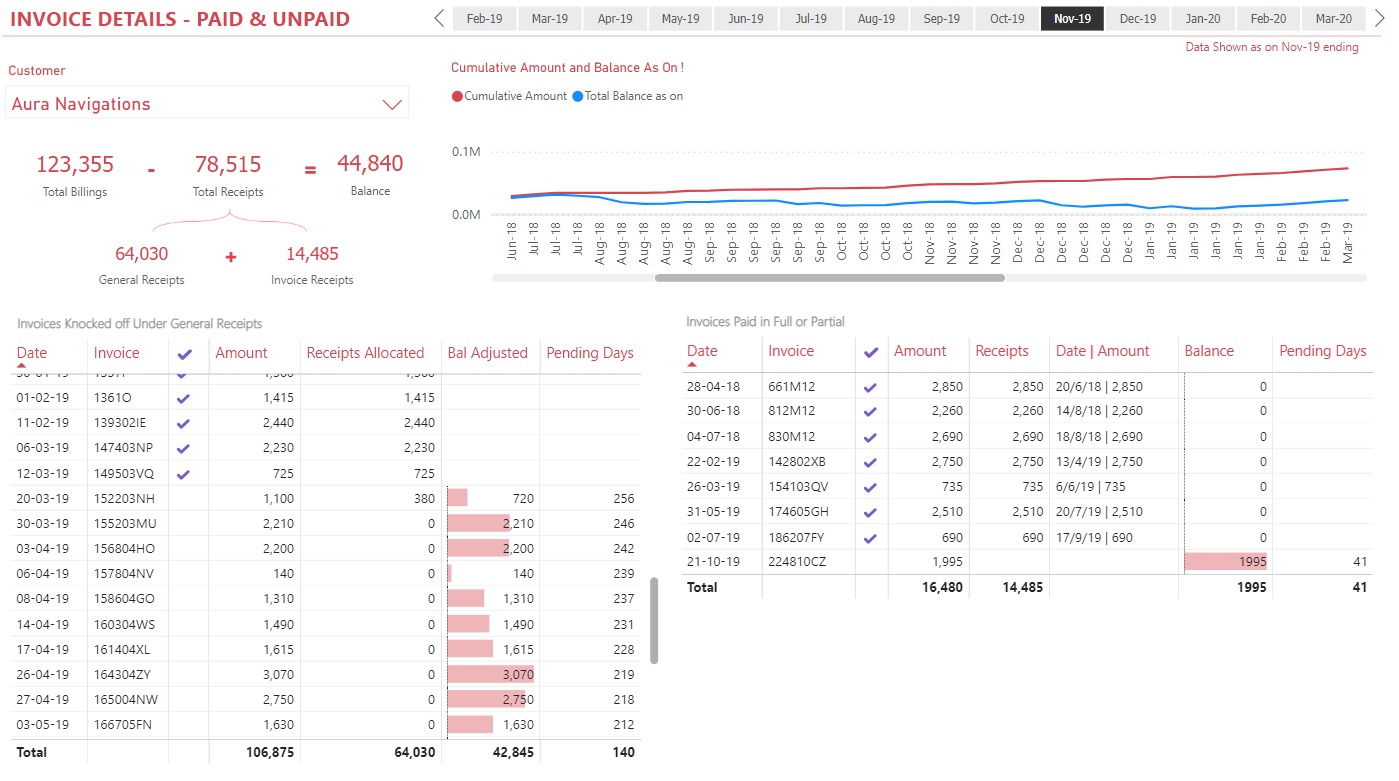
Invoices Paid and Unpaid : This view provided in-depth analysis of invoices, lump-sum payments received and how many invoices were set-off against those payments.
Key KPIs:
Total Billings, Amount Received and invoices set-off using FIFO method.
Payments against specific invoices
Invoices ageing analysis
Our Impact 🚀
The time taken to reconcile the invoices and payments received went down from a month to being available on demand.
Our solution led to a significant positive impact on cash flow by reducing working capital requirements by $600k per annum.